SEJournal Online is the digital news magazine of the Society of Environmental Journalists. Learn more about SEJournal Online, including submission, subscription and advertising information.
 |
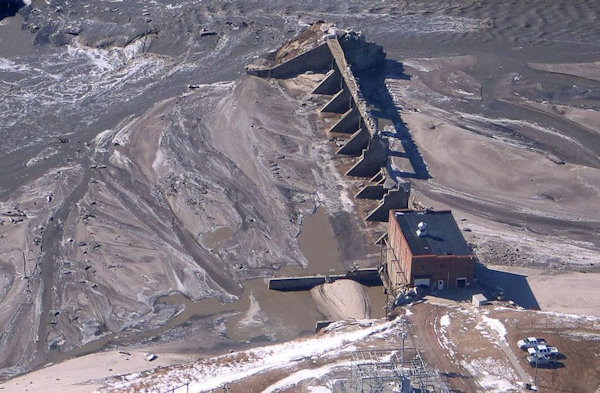
| A deadly 2019 failure at Nebraska’s Spencer Dam, shown above, featured in an Associated Press data reporting investigation that identified at least 1,680 dams in 44 states and the U.S. territory of Puerto Rico that are considered to be a high hazard and in poor or unsatisfactory condition. Photo: Nebraska Emergency Management Agency, Flickr Creative Commons. Click to enlarge. |
Reporter’s Toolbox: Data Project Details Nation’s Disintegrating Dams
By Michelle Minkoff
More than 1,600 of the country’s dams are in poor or unsatisfactory condition, and loom dangerously over homes, businesses, highways or entire communities that could face life-threatening floods if the dams don’t hold.
Compiling the downstream hazards of the dams and their assessed conditions was the subject of a recent Associated Press dam safety investigative project. It took more than two years to collect, integrate, verify, analyze, report and present the massive dataset collected, encompassing data for more than 90,000 dams across the country.
Here’s a closer look at the process to create this story.
Gathering, sorting massive dataset
Dam data is currently distributed through the National Inventory of Dams, or NID, but that data does not include dams’ condition assessments, which were sealed off from the public soon after the 2001 terror attacks. The federal dataset now includes hazard levels, but did not at the time the AP began the project.
The AP filed FOIA requests in all 50 states
and Puerto Rico to obtain the data that
state agencies had submitted to
the National Inventory of Dams.
The AP filed Freedom of Information Act requests in all 50 states and Puerto Rico to obtain the data that state agencies had submitted to the NID, which would include these key columns.
The AP received the data in many different formats. Some states provided PDF scans of spreadsheets, some provided spreadsheets themselves and some provided the information as text that had to be converted into a structured spreadsheet format. The open-source tool Tabula was used to get structured tables out of PDFs.
The next step was one of the most painstaking parts of data acquisition: standardizing column names. Different states might name a condition assessment column as "COND", "cond", "Cond", "Condition Asst", etc. A master spreadsheet file was compiled that listed each state in a different column, and each row represented a column in the original data.
How each header was named in each state was specified in a spreadsheet, and then on the rightmost column of the spreadsheet, a standardized name was provided for each data column. A Ruby script was used to process every state's Excel file into a CSV and replace each sheet’s headers with the standardized column names.
This allowed the AP to use a loading script in R to stack all the CSVs with matching headers into one giant data set, which eventually contained data from states as well as the National Inventory of Dams, for all dams in 2016 and 2018. The final dataset totaled more than 250,000 records, which was then filtered down for various analyses.
The final analysis only included dam data from 2018 for facilities where the dam’s nid_id (unique identifier) was included in the NID. Six states would not provide the AP both columns of hazard and condition assessment information, so those states were excluded from the analysis.
For the 44 remaining states and Puerto Rico, NID data was used to substitute in hazards in two cases where hazards were not provided by state data, most often due to security exemptions.
Finally, the AP’S data set was filtered to include about 82,000 unique dam assessments from 2018. Of those, the analysis then focused on dams that were high hazard, meaning their failure was likely to cause at least one death. The analysis then looked at the subset of those that were rated in poor or unsatisfactory condition during their most recent inspection.
Analyses were also performed to identify dams with inspection dates older than the state-mandated inspection frequency, as well as those whose emergency action plan was out of date.
Detailing downstream hazards
The next step was to request emergency action plans and inspection reports for the more than 1,600 dams that were high hazard and in poor or unsatisfactory condition, to get further information.
Emergency action plans were particularly interesting,
because they often detailed downstream hazards —
meaning houses and businesses that would
likely be affected if a dam were to fail.
Emergency action plans were particularly interesting, because they often detailed downstream hazards — meaning houses and businesses that would likely be affected if a dam were to fail. Sometimes these documents even included names and phone numbers of people who could be interviewed, providing a treasure trove of information for reporters.
 |
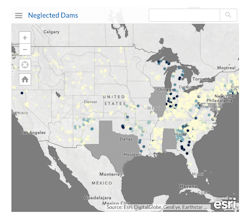
| Hazardous dams found by an AP investigation plotted on the interactive map. Image: Associated Press. Click to enlarge. Or visit the interactive project. |
Getting the plans and the inspection reports required another round of FOIA requests. Some states had to collect these documents from multiple regional offices; others provided some files but left out parts of the AP’s request, and still other states only had these documents in paper, so an AP reporter had to go and scan them in person (using mobile phones and the Microsoft OneNote app).
To sift through all of these documents — and to help the AP’s members explore them — the AP built a web application that allowed users to search for all the inspection reports and emergency action plans that had been received for either a specific dam or for all the dams in a state.
The AP also partnered with ESRI to create an interactive map, using the latitude and longitude data provided by the various states and the NID.
Zeroing in on dangerous dams
With the data and reports in hand, AP reporters, data journalists, photographers and video journalists began focusing on specific dangerous dams across the United States.
The AP’s national story from me and my colleagues David A. Lieb and Michael Casey reported on Nebraska, where a dam failure in 2019 killed a downstream resident, and from outside Boston and Atlanta, where problem dams threatened homes.
But with hundreds of dams at issue in dozens of states, the AP also wanted to help its own state staffs and local news organizations tell this story in their areas. So the data and documents were shared under embargo with members through the AP’s data.world distribution program, enabling local reporters to focus on specific dams of regional interest and write stories with a regional focus.
On the day the AP story published,
dozens of news organizations —
from TV stations to local newspapers
— published their own stories on the issue.
The AP led a webinar to guide reporters on how to use the data in their area, and on the day the AP story published, dozens of news organizations — from TV stations to local newspapers — published their own stories on the issue.
The package won play on at least 80 newspaper front pages, whether it was the AP national story, an AP state sidebar or localizations by an AP member, such as those produced by the Arkansas Democrat-Gazette and Dayton Daily News.
AP’s stories had more than 1,000 digital downloads among the cooperative’s customers and prompted several editorials urging lawmakers to prioritize dam funding (may require subscription) and inspections.
The investigation prompted U.S. Sen. Kirsten Gillibrand of New York to call for more federal oversight and funding to shore up the nation’s aging dams.
AP reporters also partnered with the Columbus Dispatch (may require subscription) to supplement its ongoing coverage of dam infrastructure in Ohio.
Organization, request tracking were key
One of the greatest lessons learned throughout this process was the importance of organization. Identifying what columns of data to acquire, how column names were standardized and how to vet the completion of the data were key.
Even more important was keeping extremely detailed track (using a Google spreadsheet) of all outstanding requests, their status, what data had been vetted and the names and numbers of our contacts at various state agencies.
The AP also developed relationships with sources. Reporters had years-long discussions with state employees and dam safety experts, and in some cases even saw employees come and go during the process of working with the AP.
In some states, AP was able to receive additional or updated information simply by having a casual conversation with the key contact, rather than having to resubmit a formal request over and over.
Finally, the AP has seen the worth of compiling data that can be used as an ongoing resource in covering breaking news and local issues. Since the project ran last November, the AP has returned to the dataset several times to help report on dam breaches and infrastructure problems.
The AP plans to continue to update the data, using it to gather additional insights on dams in general and to provide a closer, more granular look at individual dams.
 |
Note that if you or your news organization are interested in enrolling in AP's data distribution program, please email apdigitalsales@ap.org.
Michelle Minkoff, a data journalist and interactive developer at The Associated Press since 2011, creates, cleans and analyzes data sets, as well as designs and develops data visualizations, with a special interest in environmental reporting. Previously, she worked at PBS and the Los Angeles Times and taught data journalism at Northwestern's Medill School, of which she is a 2010 graduate.
* From the weekly news magazine SEJournal Online, Vol. 5, No. 7. Content from each new issue of SEJournal Online is available to the public via the SEJournal Online main page. Subscribe to the e-newsletter here. And see past issues of the SEJournal archived here.


 Advertisement


